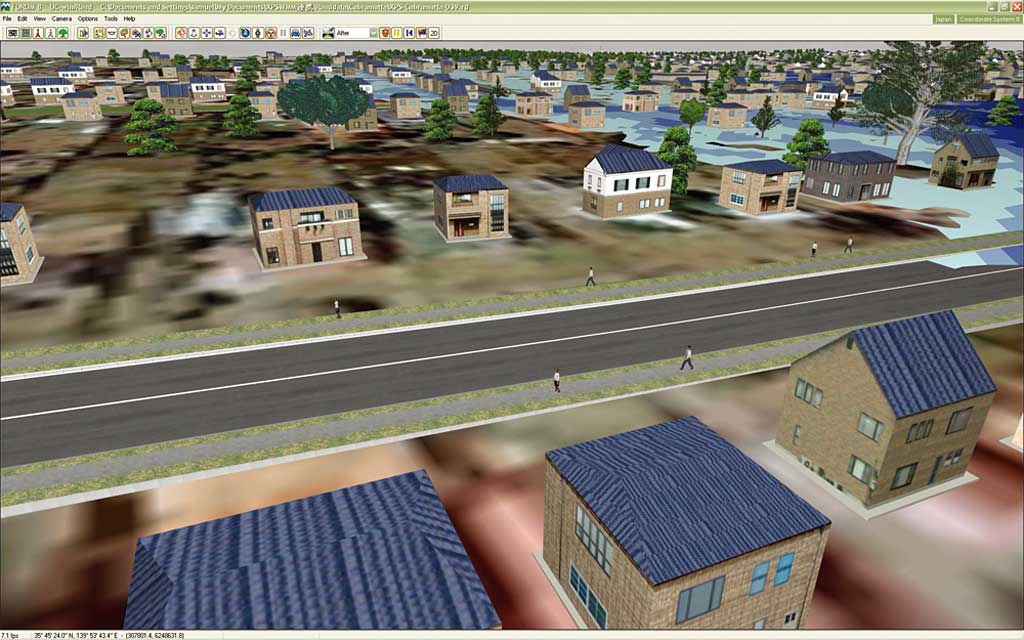
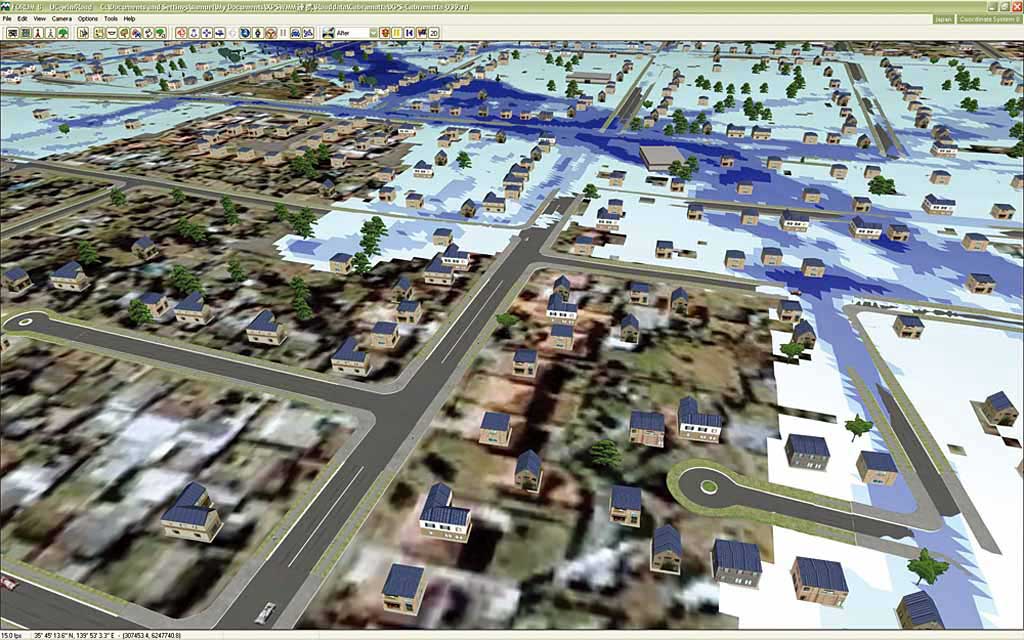
UC-win/Road for xpswmm is a plug-in tool of UC-win/Road, which imports
flood analysis results and displays the time series change of the rise
and fall of flood waters, the water flow vector and level as well as displaying
the drainage network.
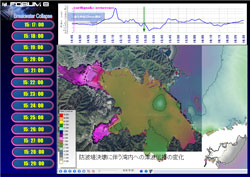
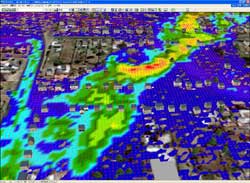
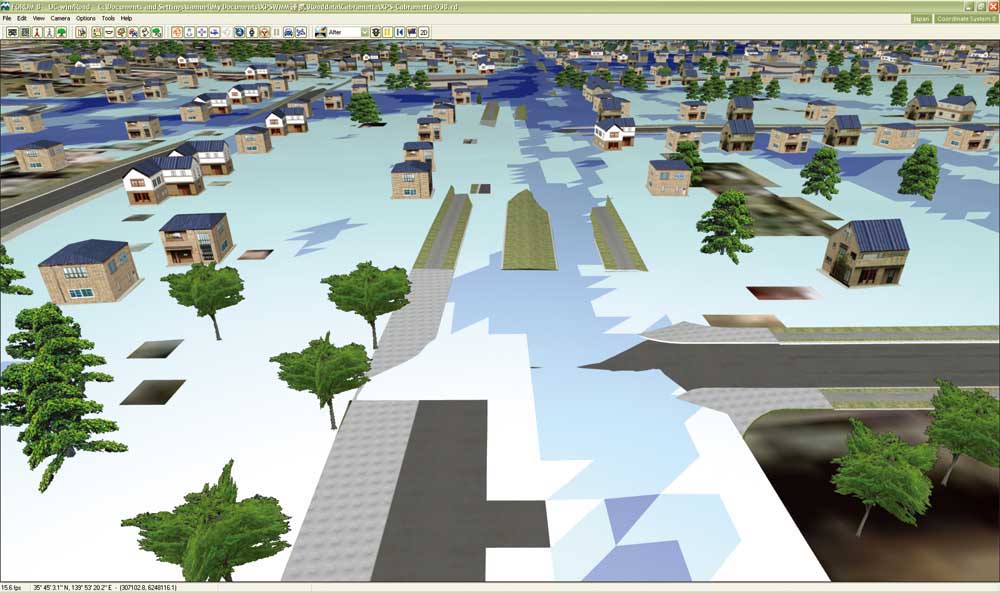
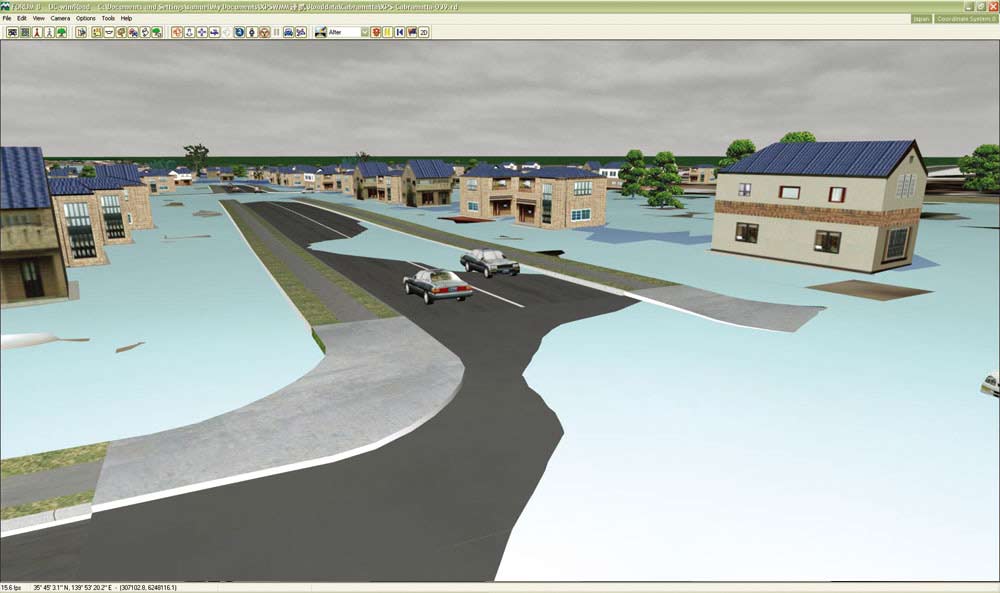
Time series change of rise and fall of flood water surface
Xpswmm plug-in(free license version) required the user to set a movable
model for the position of the flood waters. This caused a lot of work when
there was a large water surface. The new plug-in automatically expresses
the rise and fall of flood waters and reduces the time consuming process.
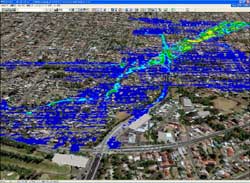
Time series change of water flow vector
The plug-in can show the time series expression of the flood water vector
and direction. It allows the reproduction of the flow visually.
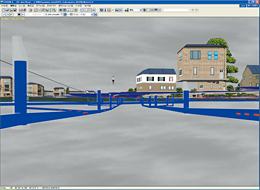
Expression of conduits and time series change of water level inside conduits
You can see the 3D VR expression of the drainage network. It can display
the time series change of the rise and fall of the water level inside the
conduits.
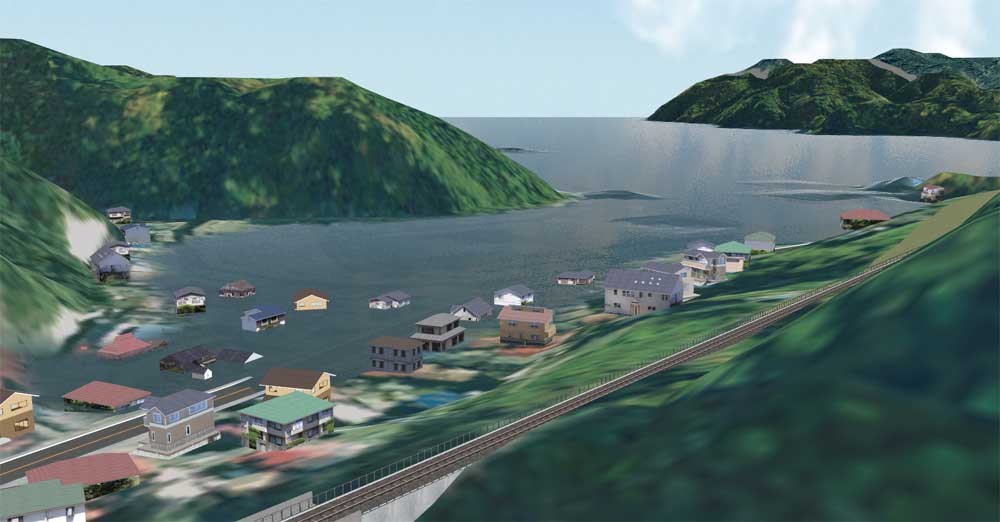
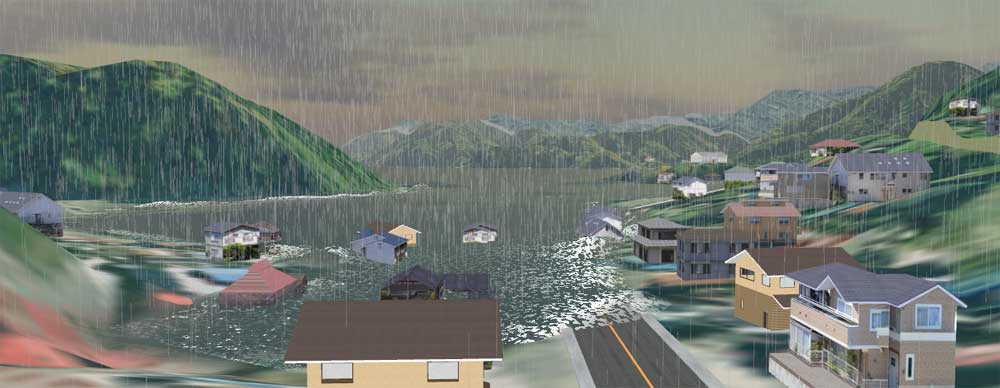
UC-win/Road xpswmm plug-in (for Tsunami)
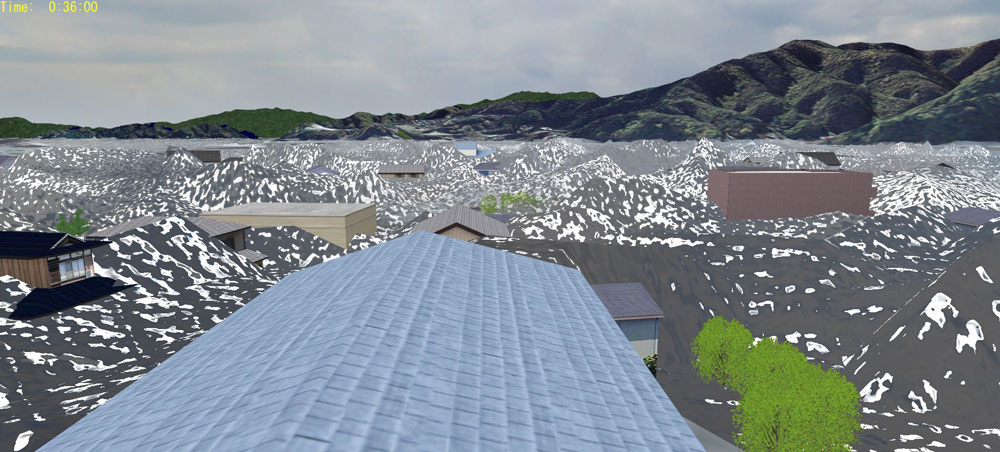
Tsunami analysis by the difference methods of the shallow water theory
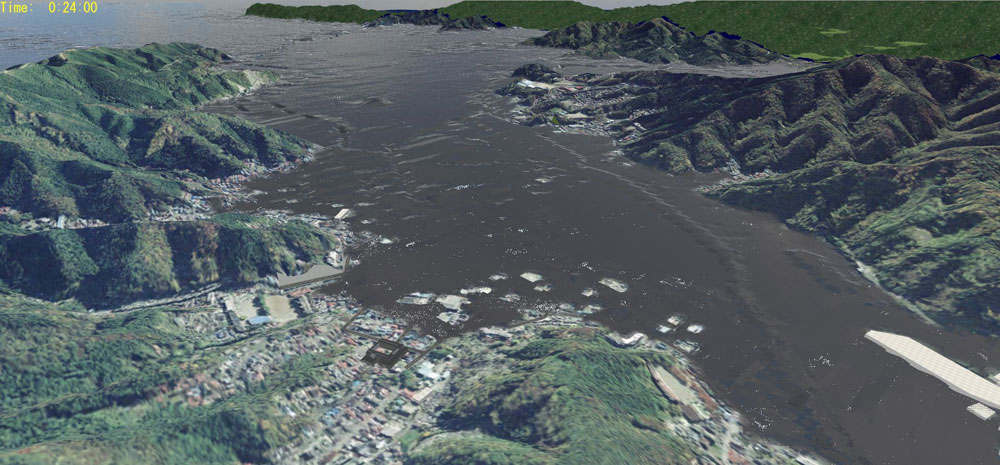
Tsunami reproducing function by 3D Virtual Reality UC-win/Road.
You can set the position, range and height with a visual option as well
as tsunami generation by linking with xpswmm. (Japanese) The inundation zone and inundation height is predicted based on the difference method of the shallow water equation. Furthermore, the plug-in can evaluate the wave power imposed on houses and buildings and calculate flotsam/ jetsam/ driftwood/debris transport as well as the wave height and velocity at each mesh point and then draw a wave height distribution map. The model that relate to the research conducted at the Tohoku University Tsunami Engineering Laboratory (run by Professor Fumihiko Imakura) is proposed in this system.
FORUM8 Design Festival 2011 The 5th Design Conference "Water Works"
session
Tsunami analysis and visualization by the xpswmm
FORUM8 UC-1 Dev. Group 1
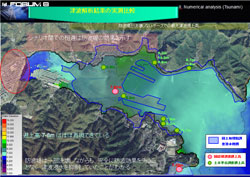
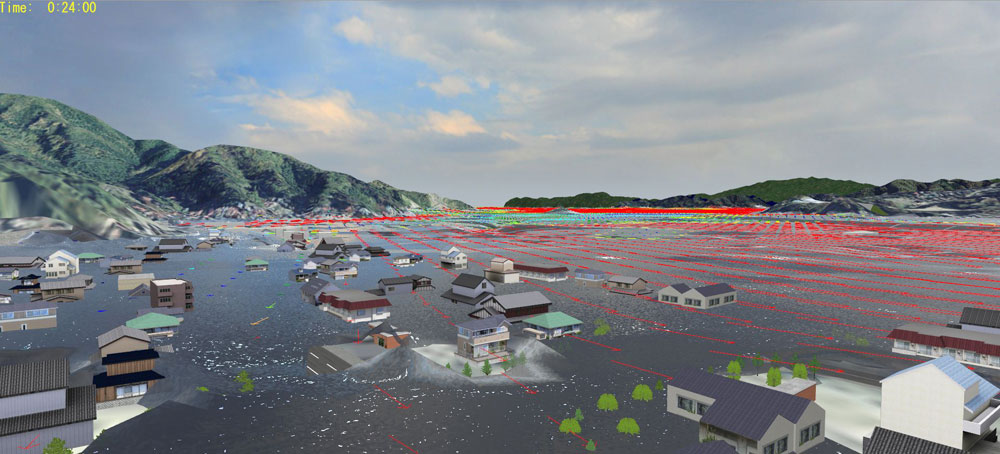
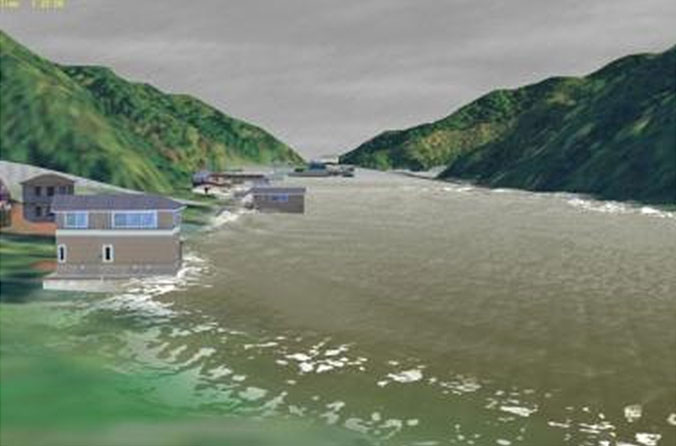
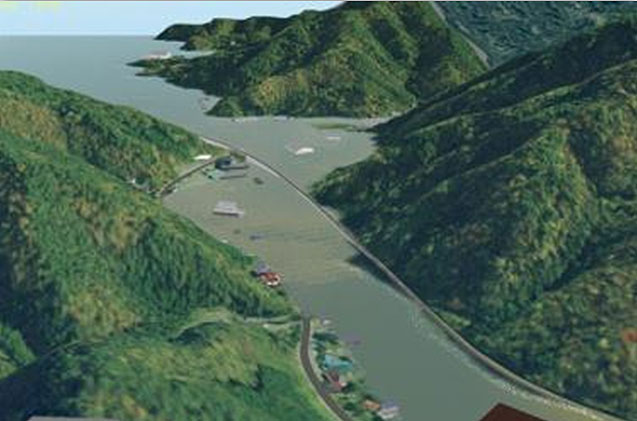
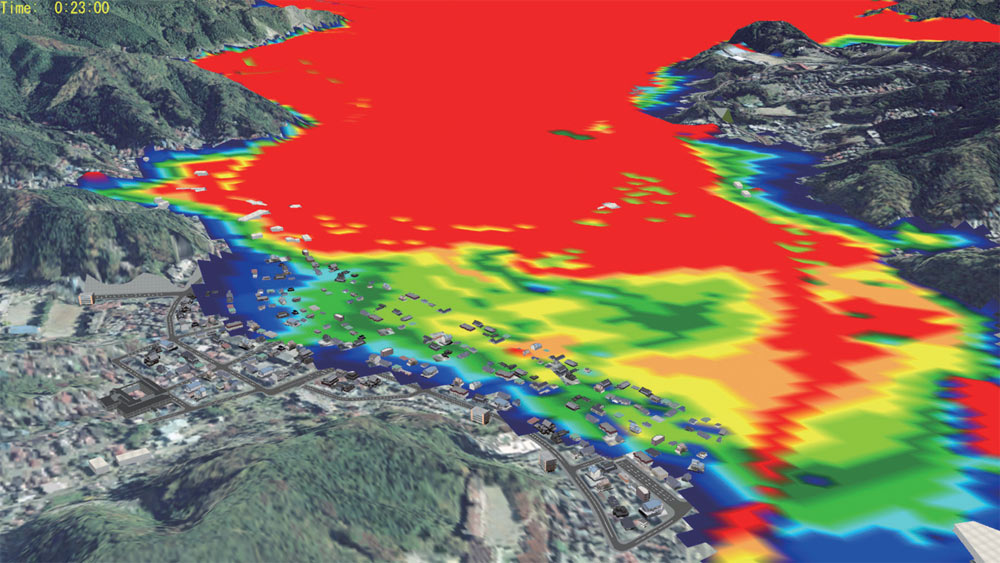
By mounting the scenario that the breakwater breaks on the way of the usual
tsunami analysis, where the breakwater is fixed as the obstacle against
the flow, the disaster damage at Kamaishi port is reproduced in the numerical
simulation in order to show the probability of visualization towards disaster
reduction.
Several tens of seconds after
tsunami coming (contour figure)
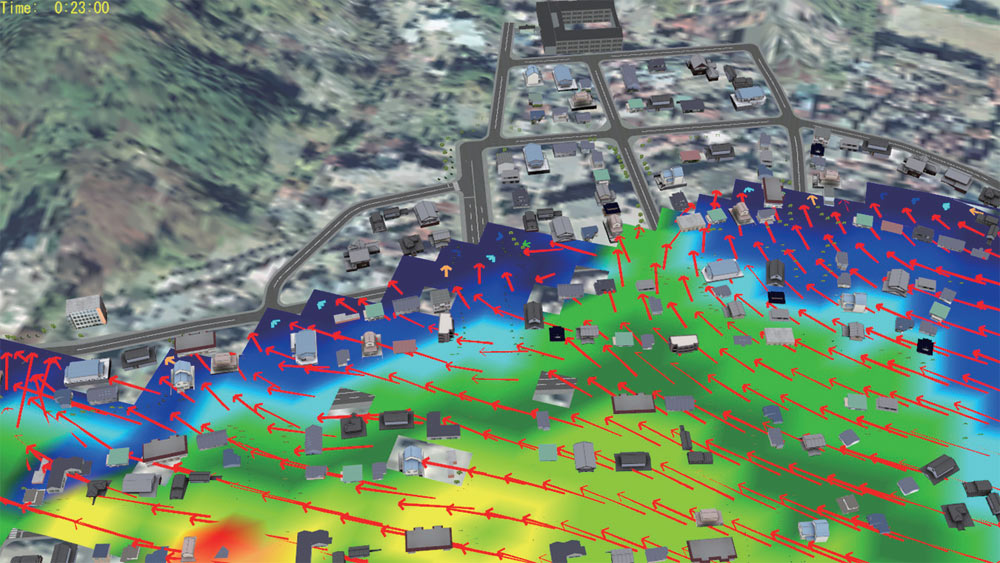
Vector of tsunami flow velocity
Mechanism of tsunami generation
If an earthquake occurs, the uplift or subsidence is caused by ground movement
under the sea bottom. With this movement, the overlying water vertically
displaced, and the spread of water generates tsunami. When tsunami warning
is announced, ships inside port go out of the port to avoid tsunami strike.
That is because the energy of tsunami is smaller due to the deep water
compared with shallow water area. The word tsunami derives from the larger
damage on ships in the port (=tsu) compared with that of offshore. Currently,
the word "tsunami", is also used in English.
Fig.1 Image of
tsunami occurrence
The velocity of tsunami is obtained by multiplying the gravity by water
depth and rooting the value(v=√gd). If the water depth is 4000m, the velocity
of tsunami is approximately 720km/h(200m/S). It almost ties that of jet
airplane.
Tsunami analysis case
Overview Numerical calculation of tsunami at Imamura laboratory adapts the difference method of shallow water theory. As for tsunami simulation, the laboratory conducts run-up simulation which predicts inundation area and its water depth caused by possible Tsunami. Through the calculation, It evaluates wave power, calculates drift carrying capacity, the wave height and the velocity at mesh points and generates distribution map of tsunami wave height. Information on submarine topography includes documents published by Japan Coast Guard.
Input condition
The condition to be entered includes epicenter information (magnitude,
dept and position), submarine topography data (altitude and position),
and terrain information.
Analysis sample case
This is the case of Fukushima Earthquake, which occurred on July 19th,
2008. Magnitude of the earthquake was 6.6 and the depth of epicenter was
about 10km. This case shows that the result of analysis is close to the
estimation of meteorological agency, while the arrival time is 20 minutes
later than it.
Distribution map of maximum tsunami wave height
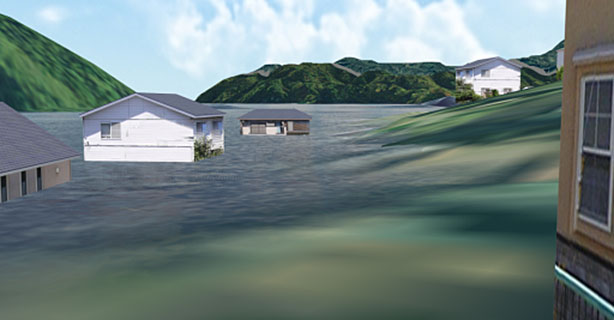
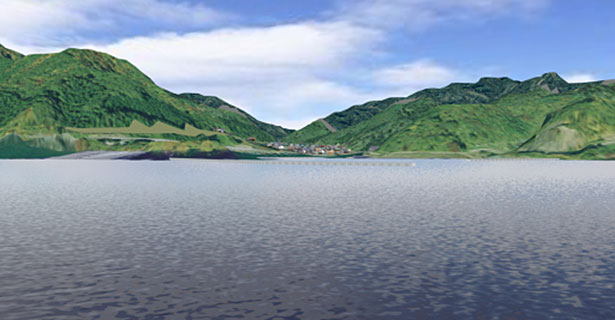
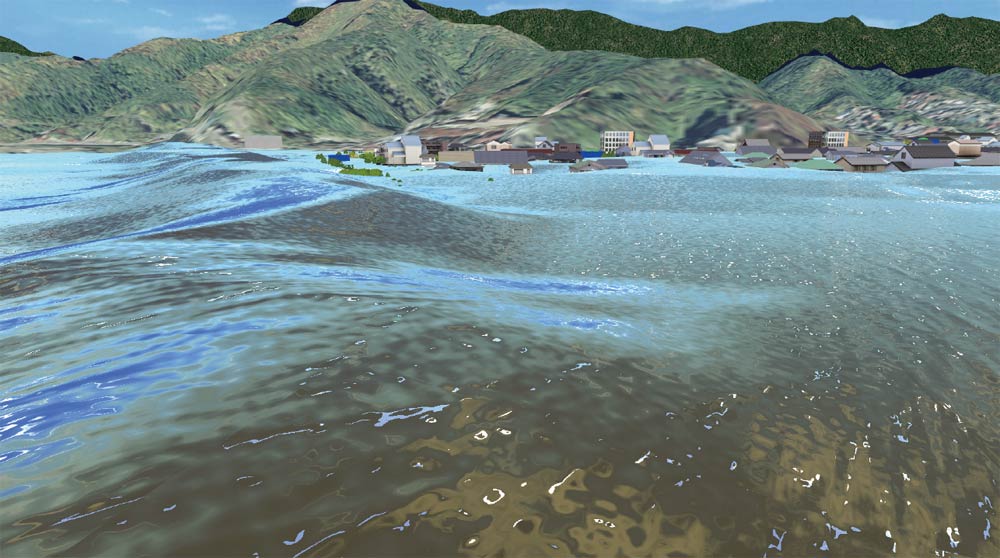
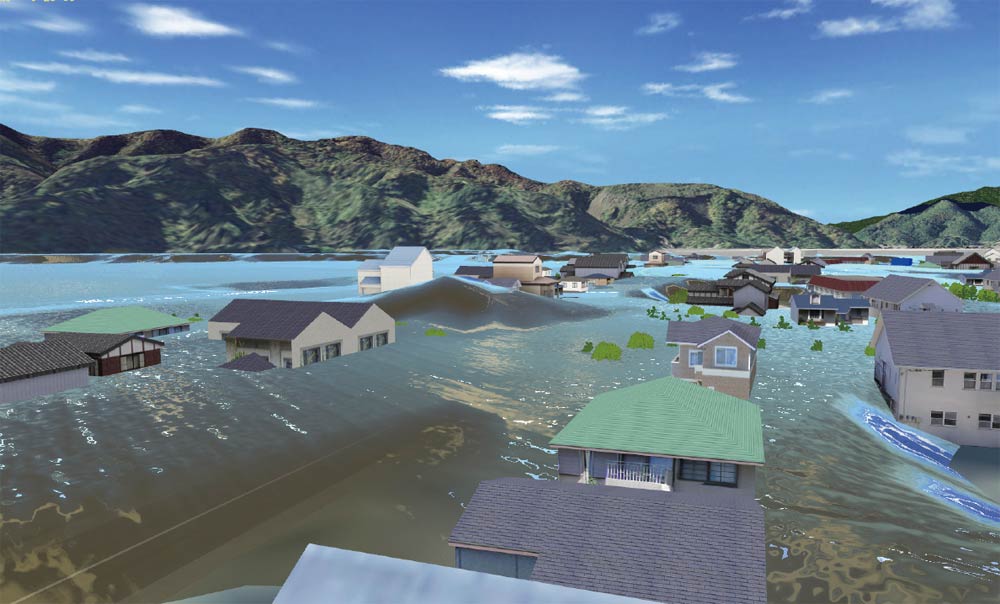
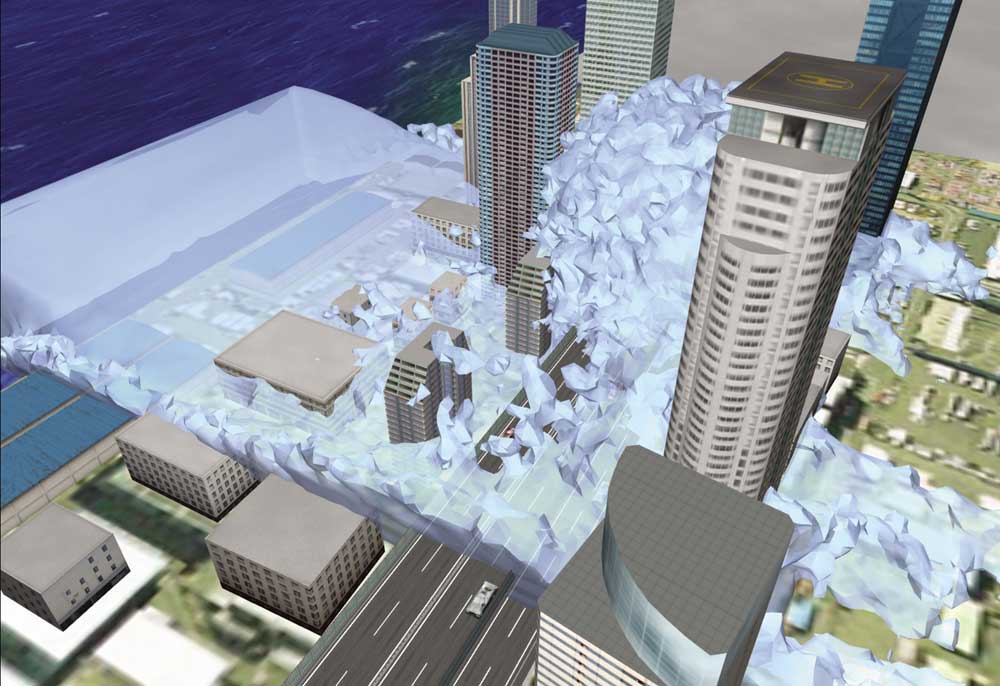
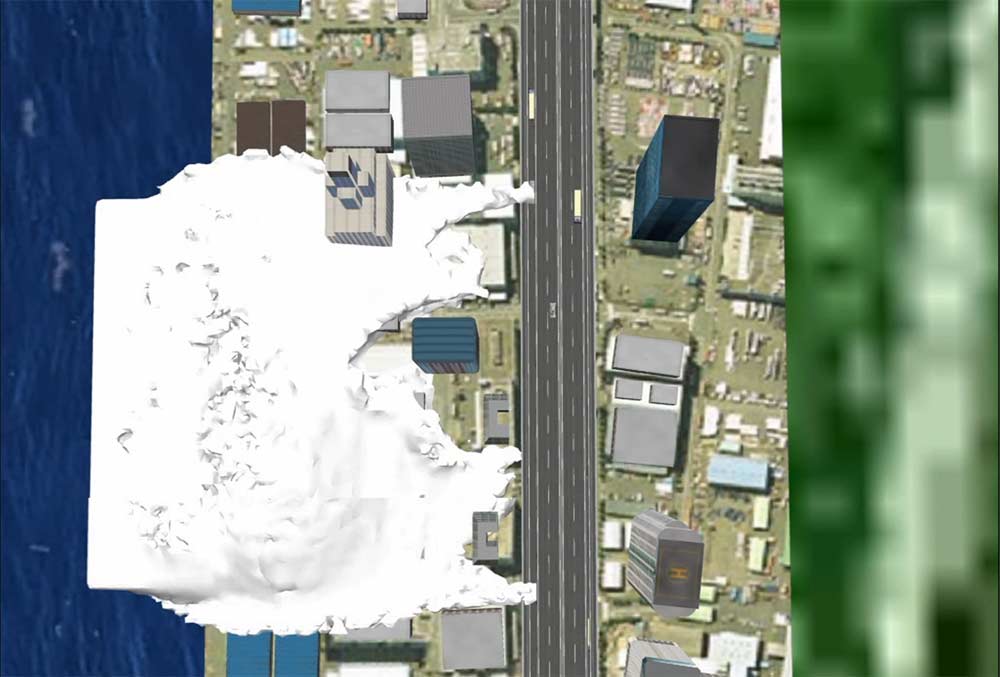
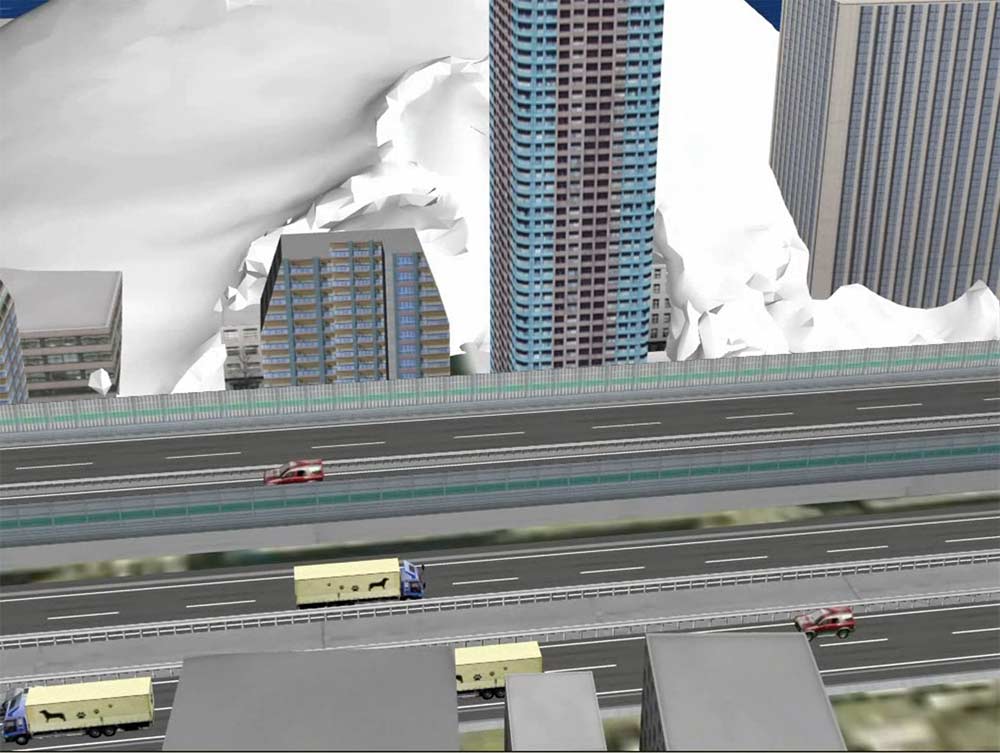
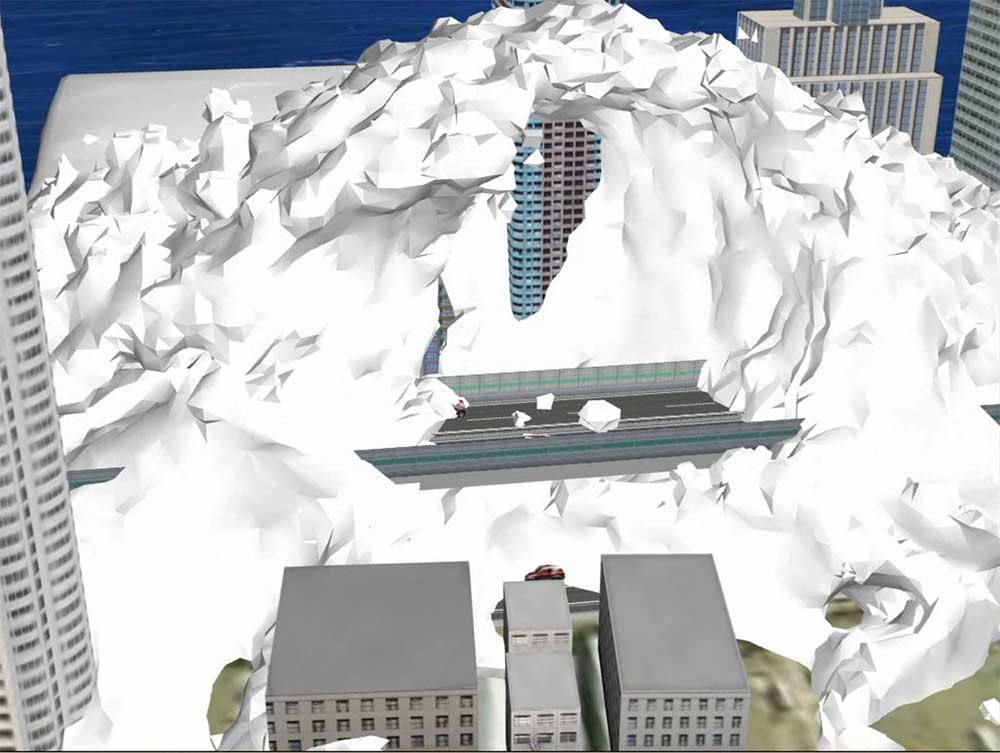
■ Tsunami simulation
(Proposed model that uses the smoothed-particle hydrodynamics analysis
result) ■
A VR model in which the smoothed-particle hydrodynamics analysis result
is put to action as movable model that moves over time within UC-win/Road. (The actual analysis result is not applied. Instead, the expression of tsunami is made possible using a VR model.)
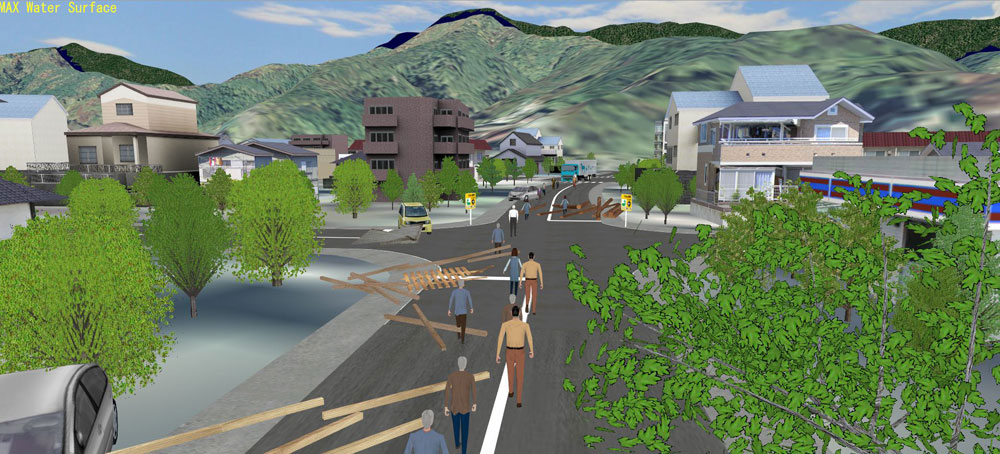
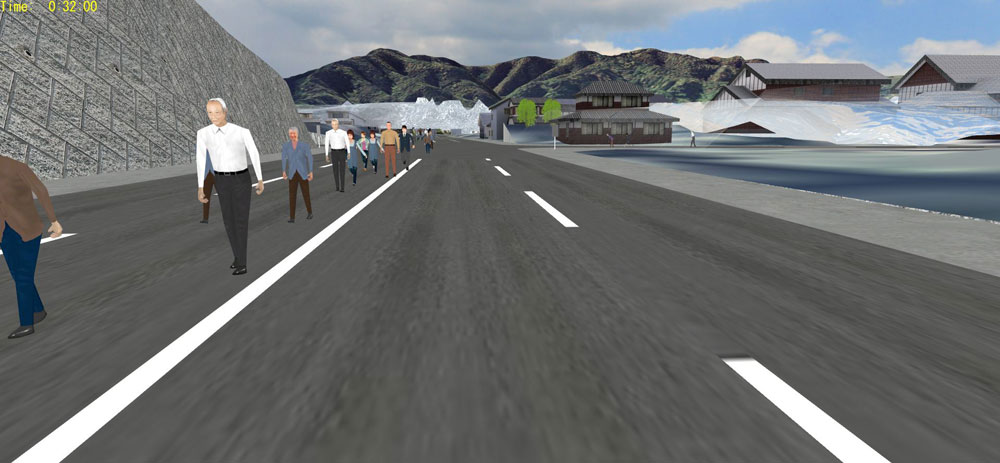
Tsunami analysis support service
This is a complete set of analysis support service in which we take advantage of the practical tsunami analysis code developed in the Imamura Laboratory to create a hazard map or predict tsunami evacuation, or link the data with UC-win/Road for a highly accurate visualization.
As long as this tsunami analysis code is used, a very accurate and useful hazard map or a very good prediction of tsunami evacuation can be made.
Because the basic information such as terrain, buildings, and trees are interfaced with Road data and imported into UC-win/Road, manual input is not required saving a considerable amount of time. In addition, the analysis result of the tsunami analysis code are imported into UC-win/Road for visualization.
Conditions that can be input The information describing the focus of the earthquake, the seabed terrain data, and terrain
Case study on tsunami analysis The result of calculation done on the Earthquake off Fukushima Prefecture on July 19, 2008. The predicted arrival time of the earthquake almost coincided with the observed arrival time.
Details of the research being conducted in the Imamura Laboratory, Tohoku
University
The Tohoku University Imamura Laboratory (lead by Professor Imamura) are
doing the following kind of research on tsunami.
Research details:
A disaster is a consequence of an interference between the natural forces and human activities within the society. As human activities and behavior change over time, so does the situation surrounding each and every type of disaster. In order to take effectives measure against future disasters we must not only base our potential measures on the aftermath of the past disasters but also predict the disaster propagation that undergo transformation with the development of society and to devise the kind of measure that has the potential to develop the region and at the same time protect it against vulnerabilities.
The Tsunami Engineering Laboratory is the only research institute in the
world that conducts research on tsunami from the engineering standpoint.
It is involved in the research based on field investigation in Japan and
abroad and on measures against tsunami disaster for a particular region,
as well as the development of tsunami’s numerical value prediction system
that is highly accurate, based on the key principle of disaster measure
and control. In particular, its tsunami analysis technique is so accurate
that it is expected to be spread to many tsunami-prone countries. In fact,
the technology transfer itself is one of the project that Tohoku University
is engaged in, which is called TIME (Tsunami Inundation Modeling Exchange).
Tsunami analysis codes developed by this research lab are already being
used in more than7 countries for mitigation of the impact of tsunami disaster.
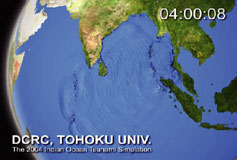
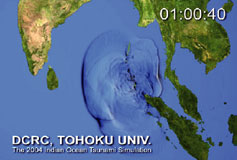
Analysis animation of Tsunami of the Indian Ocean (2004)
(Tohoku University Tsunami Laboratory)
Location of tsunami of recent years
Several functions of coastal forest in Japan
(Hamada & Imamura,2003)
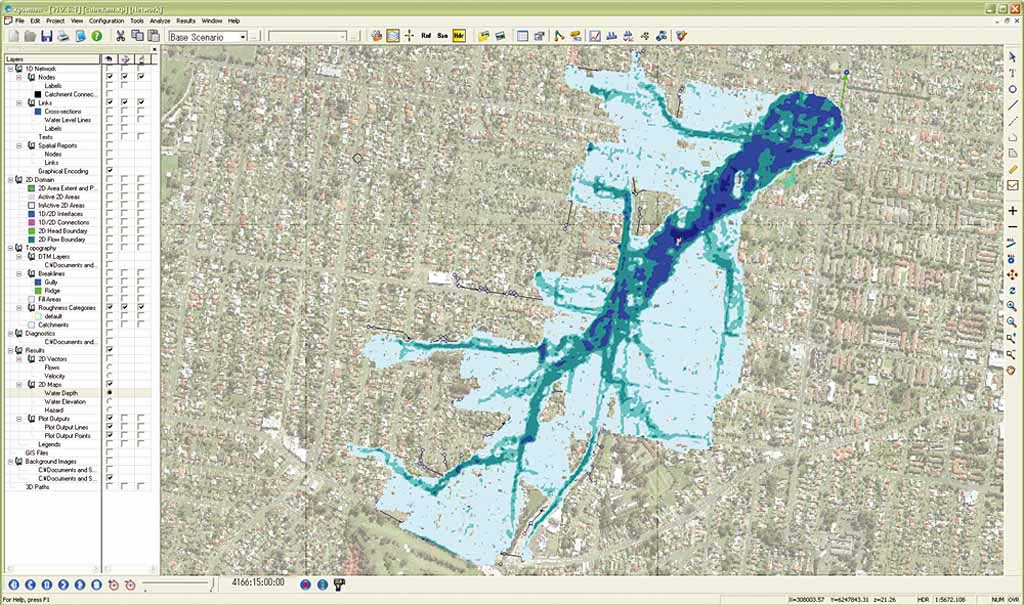
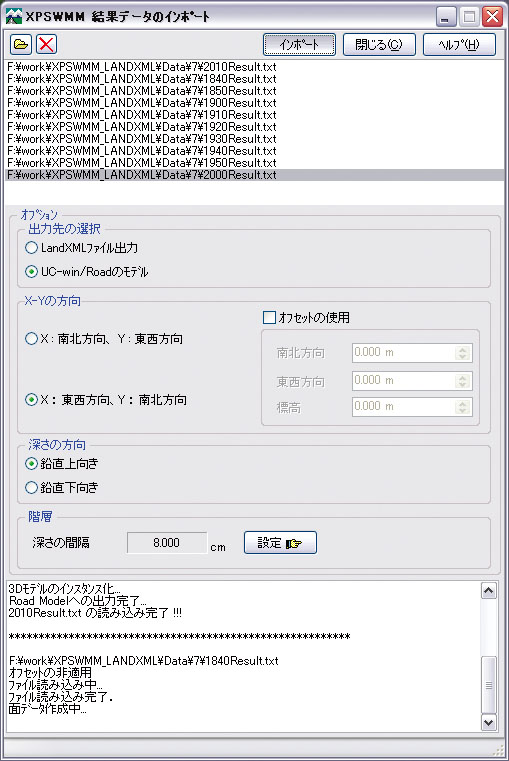
xpswmm data import screen
Using the screens below, you can adjust coordinates of the position to
be displayed and import the "result of the flood" and the "result
of conduit data"
1.Flood water surface drawing option
2.conduit drawing option
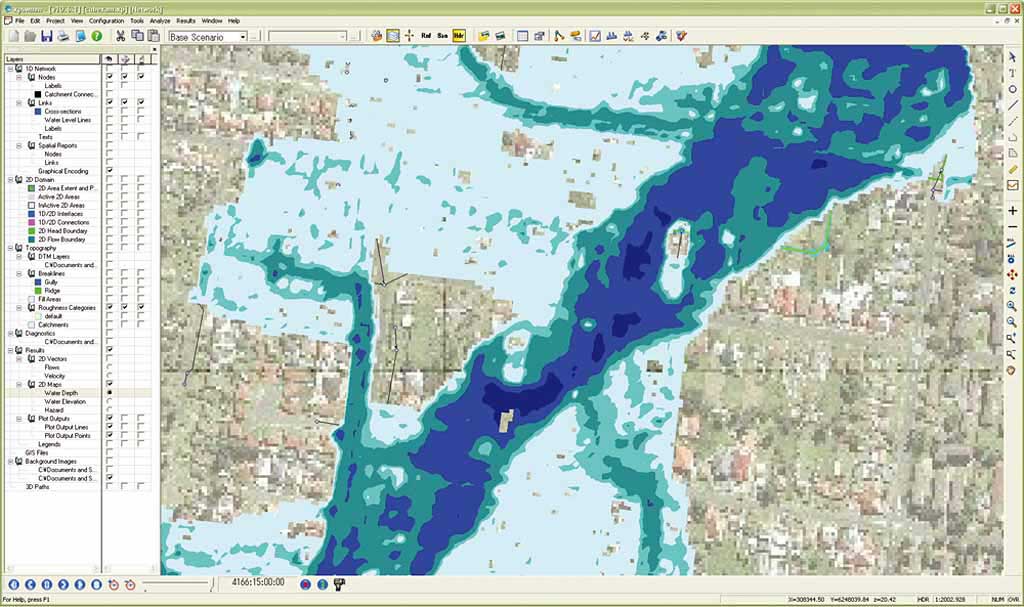
Drainage network and flow in conduit
UC-win/Road flood water surface
UC-win/Road flood water surface vector
link with "xpswmm"(xpx, xp file)
Drawing of pipes and manholes, drawing of laid drainage and manhole,
drawing of inside-pipe water flow information
xpswmm
UC-win/Road for xpswmm
Data conversion tool
UC-win/Road
Data conversion tool
1)
Selecting result files Select time history result files exported from the xpswmm.
2)
Option setting
-
Selection of output destination
Export to LandXML file and UC-win/Road model is supported.
-
X-Y directions
X and Y directions of the coordinate and Depth at each mesh position output
to the result file can be selected for each direction of the north-south
and east-west. Models are normally set in the center of the project, but
they can be arranged on other positions by using offset.
-
Depth direction
Depth direction can be selected from upper direction and downward direction.
-
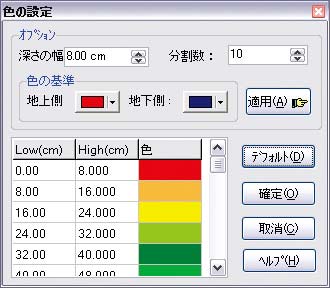
Stratum
You can set intervals of depth and colors for each depth position.