UC-win/Road 14.1 4D Simulation plugin
Simulate the progress from the project schedule definition
●New price Edit: US$2,000 Playback: Free
●Release date March 2020
The 4D simulation plug-in provides a function to manage a schedule from project schedule definition through to progress simulation while linked with 3D data. The 4D simulation plug-in was developed to provide easy-to-use project management tools linked to the 3D space of UC-win/Road, allowing users to easily model project components.

Fig.1 Example of station construction reproduction
Gantt chart
A Gantt chart is a table that visually represents a schedule. This function has the basic function of setting individual tasks included in the schedule. It also includes a function to display holidays in gray if work hours and holidays are set.
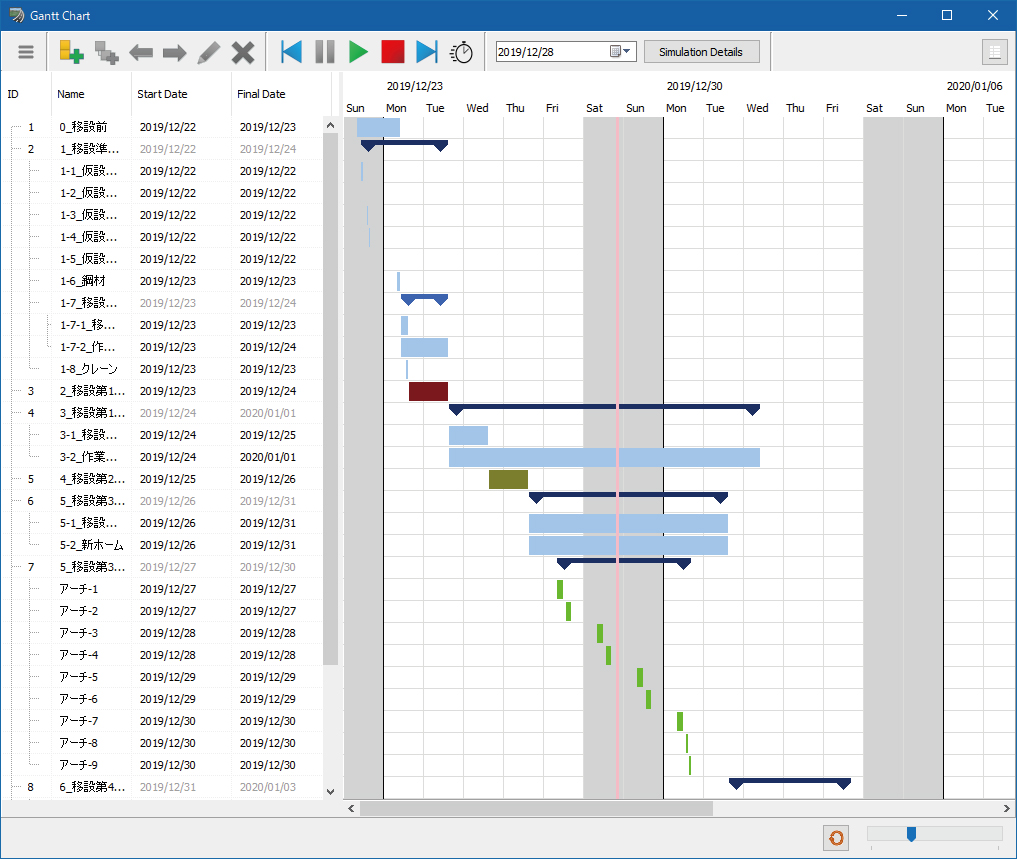
Fig.2 Gantt chart display
The Gantt chart shows the scheduled tasks. Tasks can have subtasks, and can be displayed in a tree structure. In the Gantt chart display, parent tasks and child tasks are displayed differently so that they can be easily distinguished. In addition, you can change the display color of the tasks, to easily visualize the relationships and contents of the tasks.
Each task has a start date and time and an end date and time, and can be set by date (year / month / day) and time (hour: minute: second). Task management tools include task hierarchy manipulation, such as adding tasks and subtasks, deleting or duplicating tasks, and editing the parent-child relationship of tasks by dragging them in the tree.
The zoom function allows you to view different levels of detail in the schedule. The zoom is continuous, and you can check the contents of the calendar while zooming in and out smoothly by dragging the slider or operating Ctrl + mouse wheel. At a fine zoom level, an hourly calendar can be displayed. By changing the zoom, it is possible to switch continuously to and form a daily, monthly, and yearly calendar display. This allows you to use 4D features to simulate long time-spans for general work planning, examine details of work in minutes, evaluate feasibility, and optimize complex work procedures.
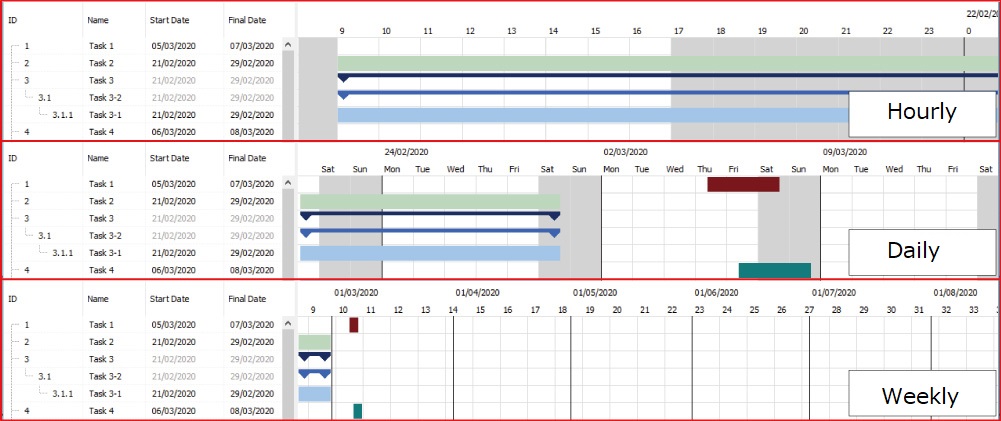
Fig.3 Differences between zoom levels
Resources & Behavior
To quickly add a 3D model read into UC-win/Road to the simulation, the user can select tasks to simulate and control a specific model. Clicking on a model will bring up a screen where you can assign that model to any task. You can set the timing to show or hide the model from at the schedule start, task start, task end, and schedule end.
For example, in a simulation of a construction site, it is possible to set up a simulation that displays the completion status of each construction stage as the schedule progresses.
It also introduces the concept of resources to include working elements such as machines, equipment, workers, moving materials and resources. Resources are assigned 3D models that exist in the project for visual display. For each resource users can define multiple behaviors that change over time.
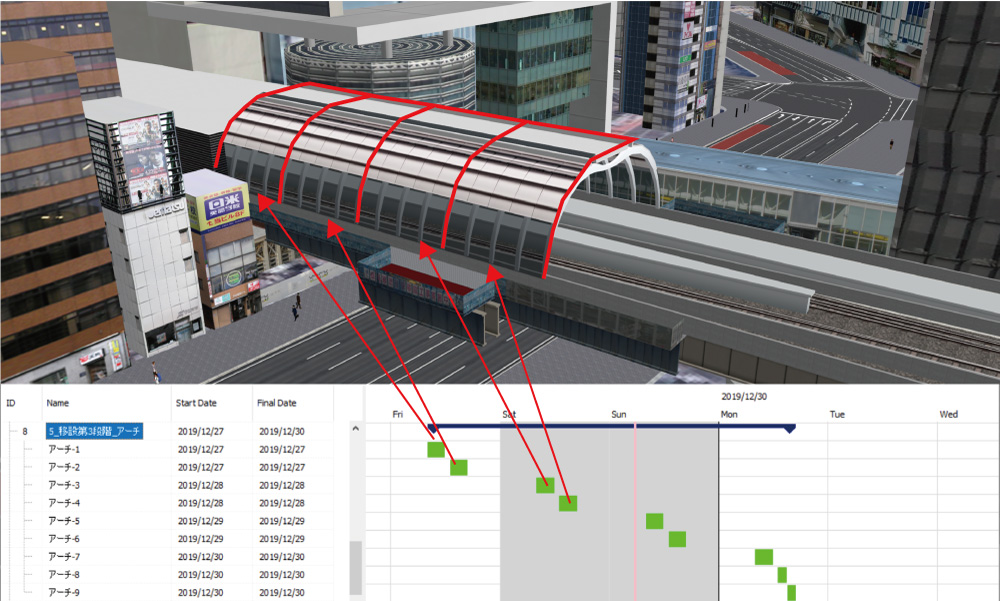
Fig.4 Correspondence between tasks and models
- Move: along a curve (flight path) or set two points and move between them over time.
- Model behavior: The movement of the parts of the model is controlled by time. It is possible to use predefined movements of a 3D model, for example the rotational movement of a crane boom.
- It can also be used to display a temporary object that does not move for a specified time period in a certain place. An example of the use of temporary objects is to place a sign around a building during construction and remove it after completion.

Fig.5 Resource operation settings
A task can have multiple actions that have different resources assigned. This allows you to group and configure resource behavior in one complex task, rather than distributing work across many subtasks. Gantt charts can be created independent of model behavior, improving readability.
Simulation & animation
Once all tasks, resources, and behaviors have been set up, you can play back the simulation and watch the project progress. Simulation provides the ability to view within the project period. Simulation speed can also be set. By changing the time scale in the simulation settings, users can run simulations in real time, or faster than the real world to see long-term schedules.
During the simulation, a time cursor indicating the date and time on the simulation is displayed on the Gantt chart. You can pause the simulation and move it back and forth from the user interface. With a simple click, you can view a specific date and time, instantly check the status of your project, and efficiently perform investigations and checks.
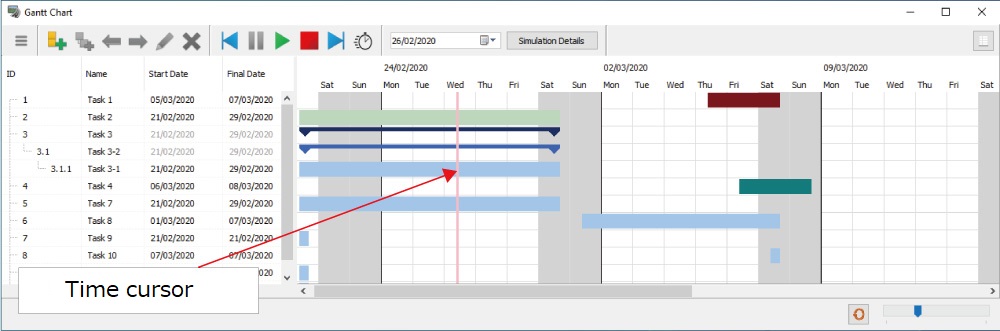
Fig.6 Replay interface
Export / Import
When the user saves the UC-win/Road project, the 4D simulation data is saved together with the RD file.
It is also possible to save the data created by the 4D simulation plug-in to a csv file. This file contains all schedules, all linked models, resources, and resource actions.
You can also import schedules from the same csv file.
It is possible to link a 3D model file to a csv file, and it is possible to collectively arrange models on a schedule simply by reading a csv file.
This enables linkage with other applications. For example, it is possible to export a pre-set schedule to UC-win/Road and pass it to other applications. Conversely, a schedule created with third party software can be imported into UC-win/Road to perform a 4D simulation that incorporates 3D space, and to check feasibility and space conditions.

Future Development
We plan to upgrade our 4D simulations to 5D and 6D simulations, as well as to make continuous improvements in line with customer requirements. First, we will introduce the concept of a unit price for resources, so that costs can be easily simulated based on the time that resources are used and the amount of movement or uptime of resources.
In addition, by assigning optional user-defined variables to tasks, efficiency, resources, workload, etc. can be calculated according to the schedule progress. We will develop a function to summarize these variables into expressions and create graphs.
We will show the relationship between elements such as resource procurement, transport time, wait time, etc., to permit use for study and explanation of schedule optimization and consensus building.