Introduction
The Eco-Drive plug-in of UC-win/Road is new software module that calculates the fuel consumption and carbon footprint of individual vehicles whilst driving through a 3D VR model and graphs the results by means of UC-win/Roadfs driving log.
Evaluation Formula of Carbon Footprint *1
In general, a vehiclefs carbon dioxide emission or carbon footprint (E) is in proportion to its fuel consumption. Therefore to be able to calculate it we require key factors such as "travelling time T" and "travel distance D" as well as the variation in speed "Fluctuating vehicle speed".
The Eco-Drive plug-in calculates fuel consumption and carbon footprint using a formula (1) based on results obtained from the UC-win/Road driving log.
T: Travel time (sec)
D: Travel distance (m)
K: The number of the speed measurement point
: When a speed is higher than at the previous point; 1
Other case; 0
vk: Running speed at "K" point (m/sec)
Kc: Emission factor CO2 0.00231 kg-C/petrol (cc) (Ministry of Environment, 1999)
*1 T.Oguchi, M.Ktakura and M.Taniguchi" Carbon Dioxide emission model in actual urban road vehicular traffic conditions", Journal of Infrastructure Planning and Management (JSCE), No.695/IV-54, pp.125-136
Major Features
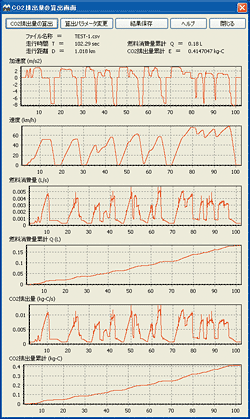
The Eco-Drive module is situated in the UC-win/Road tools menu with two separate functions. Firstly the user can activate an gEco-Drive log output functionh alternatively they can "Calculate the carbon footprinth. The various parameters within the Eco-Drive evaluation formulae are all capable of being altered by the user. All Eco-Drive data is automatically saved within the Drive Log data file so that calculations can be re-created at a later date.
In the result of "Calculate Carbon Footprint", the values such as Travel time (T) and Travel distance (D), fuel consumption (Q), and Carbon Footprint are displayed. A number of graphs are available in the graph create function, for instance, acceleration and speed, fuel consumption over time, cumulative fuel consumption, carbon footprint per hour, cumulative carbon footprint. In addition the user can output a result as a CSV file and use it with Microsoft Excel.
Validation Example
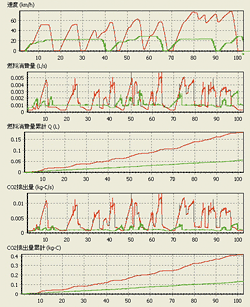
A simple experiment was conducted to calculate the carbon footprint generated under the two different driving conditions of sudden starting and stopping and one of driving more egentlyf. A evirtualf car was driven through one of Forum 8fs 3D City Models using the UC-win/Road 3D Virtual Reality software system with the Eco-Drive plug-in. The conditions were as follows; (1) Drive a course of distance 1km, (2) Must stop at an intersection, (3) No speed limit, (4) Try several different type of driving from gentle to rough.
The following results were obtained:
| Case Name | Travel Distance(km) | Fuel Consumption(L) |
Carbon Footprint(kg-C) |
Driving Condition |
| TEST-1 |
1.018 | 0.180 | 0.415 | Repeat "sudden starting" and "sudden stop" |
| TEST-3 |
1.018 | 0.147 | 0.339 | |
| TEST-4 |
1.025 | 0.102 | 0.237 | Try not to do "sudden starting" and "sudden stop" |
| TEST-5 | 1.02 | 0.098 | 0.226 |
Conclusion
Driving hard with sudden stops and starts results in an increase in both fuel consumption and carbon footprint. On the other hand, when driving more gently, the results of both fuel consumption and carbon footprint tend to decrease.
 |
 TEST-5(Green) |
|||
