 Introduction Introduction
4 of the main revisions in Engineer's Studio(R) Ver 1.03.00 are as follows.
- Able to input node mass onto a graph
- Initial section force of beam element
- Eigenvalue analysis in considering geometric rigidity
- Display contour chart of plate element
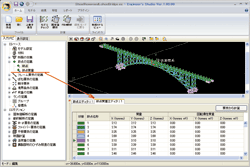
 Input node mass into a graph. Input node mass into a graph.
Mass can now be directly applied to the node (figure 1). On one node, 3
components of translational direction (X, Y, Z of the entire coordinate
system) and 3 components of rotational inertia mass (Around X axis, around
Y axis, around Z axis of the entire coordinate system), a total of 6 components,
are applied.
Node mass can also be computed from elements.&
nbsp; By clicking the "Calculate from elements" button, the result
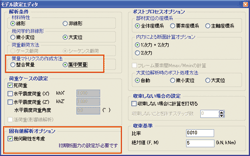
can be computed automatically. Node mass is enabled when "Creation
method of mass matrix" in the model settings window is specified as
"Concentrated mass" (Figure 3). Although concentrated mass method
is known as a method that is not very precise, it is often used because
the concept is simple and because internal mass matrix is only shown as
diagonal element, that results in an easy matrix calculation. When node
mass is applied in a graph format; dead load and seismic static load, which
are computed automatically by the program, are also reflected as the concentrated
load on the node. |
|

 figure1 Input node mass onto a graph figure1 Input node mass onto a graph |
 Initial section force of beam element Initial section force of beam element
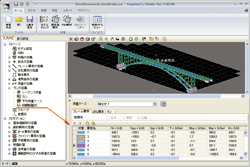
Inital sectional force can now be set on beam element (figure 2). Not
only members, but spring element can also be applied. Initial section force
is the force realized as initial stress state before weight is loaded.
For beam element, bending moment, shear force, and axial tension of end
material is applied. For spring element, force in of xl direction, force
in yl direction, force in zl direction, and moment of the area around each
of their axis on spring element's element coordinates are applied. In this
version, initial section force cannot be applied to plate element, however,
we are planning to make this possible in the future. |
|

 Figure 2 Initial section force of beam element Figure 2 Initial section force of beam element |
 Eigenvalue analysis in considering geometric rigidity Eigenvalue analysis in considering geometric rigidity
In the eigenvalue analysis, eigenvalue intensity number ƒÖ is found by
solving
|[K]-ƒÖ2 [M]|=0
with [K] being rigidity matrix and [M] being mass matrix. Up until now,
linear elasticity's rigidity matrix [K0] was being used for rigidity matrix
([K]= [K0]). In this version, geometric rigidity [KG] can also be considered.
When geometric rigidity is considered, [K] in the above formula becomes
[K]= [K0]+[KG]. It is specified in "Eigenvalue analysis option"
in the model settings window (figure 3). Initial section force must be
set in order to create [KG]. |
|

 Figure 3 Model settings window Figure 3 Model settings window |
 Contour Chart of Plate Element Contour Chart of Plate Element
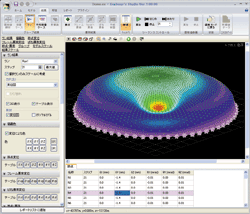
The result of plate element is visualized on a full color contour chart
(figure 4). Results that can be displayed on contour chart are deformation,
stress, distortion, curvarture, and section force (inplane vertical force,
plane bending moment, plane shear force). Even if the Plate element is
elasticity element or non-linear element, these results can be displayed.
The number of elements tend to increase if the infrastructure is modelled
using plate element. As the number of elements increase, the result of
calculation will also increase. For this reason, keeping all the results
in every step of the analysis is difficult. This program saves all the
results related to the node (deformation, counterforce) ; and the step
where the type of the concerned result becomes the maximum and minimumm,
in the result related to element. Therefore, animation function where the
color of contour chart changes in ascending order from step 1, is for deformation
only. Contour chart that displays element's stress, distortion, curvature,
and section force is actually the contour chart for the step where each
of these numerical value becomes the maximum(maximum positive number) or
minimum (minimum negative number) within the whole model.
Contour chart for deformation and model's deformation state can be animated
simultaneously. Through this animation, you can watch how the contour chart
displaying a part gradually changes color as the deformation of that part
gets bigger. |
|

 Figure 4 Display plate element on contour chart Figure 4 Display plate element on contour chart |
|


