 Functions and features Functions and features
 |
|
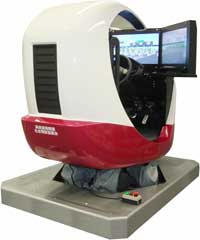
Convention on Social Contribution of Highway: Highway Driving Simulator
Technical support by: NEXCO East Japan( East Nippon Expressway) |
6 DOF based experience simulator SUBARU type
Customizable, portable 3ch real car parts mounted model
Order received on August 2009, Installed March 2010
 Major features Major features
- Experiencing hazardous evens on highway
- To evaluate driving behaviour and enlightening safety driving
- Collection and analysis of experience driving for safety measures
|
 |
 Experiencing 19 hazardous events on highways and its facilities Experiencing 19 hazardous events on highways and its facilities
 3 scenarios available: combination of 19 hazardous events on highway lane, exit and etc. 3 scenarios available: combination of 19 hazardous events on highway lane, exit and etc.
 Events set for the experience driving Events set for the experience driving
-
| 1. Toll gate |
a. Contacting bars at toll gate
b. Collision to stopping
vehicle
c. Contacting to attached structure
d. Overcrowding at toll
gate |
| 2. Main line |
a. Collision to stopping vehicle
b. Low visibility (foggy
etc.)
c. Slipping by snow or rain
d. Jumping the queue
e. Fallen object
ahead
f. Accident in congestion tail
g. Overtaking through the center
h. Lane restriction |
| 3. Rest area |
a. Contacting to crossing pedestrian
b. Contacting with
other vehicle
c. Vehicle using smart IC |
| 4. Main line confluence part |
a. Confluence timing |
| 5. Main line branch part |
a. Lane deviation by speeding at curve section
b. Ramp
congestion |
| 6. Main line etc. |
a. Reverse run |
 Menu Menu
-
| Step |
Items |
On screen image |
Normal
mode |
Quick
mode |
| 1 |
1 |
Opening |
 |
| 2 |
 |
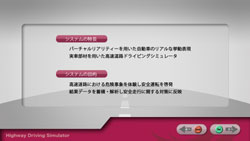
System
overview |
 |
| 3 |
 |
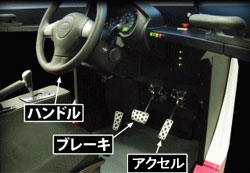
DS device |
 |
| 4 |
2 |
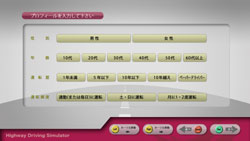
Drivers profile |
 |
| 5 |
 |
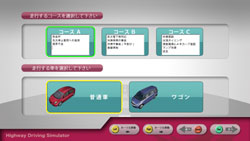
Course selection |
 |
| 6 |
3 |
About safety device |
 |
| 7 |
4 |
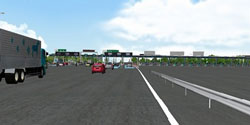
Driving |
 |
| 8 |
5 |
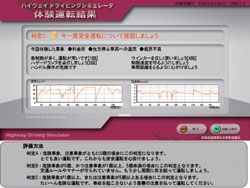
Result |
 |
| Result of experience driving |
Sample: Result of experience driving (Available in Japanese)
The simulator analyzes driving log and creates printable
reports. Followings are the analysis on safe driving behavior:
- Acceleration aggressiveness from acceleration graph and rapid acceleration
trend beyond the set value;
- Braking severity from deceleration graph, braking severity
trend beyond the set value;
- Number of lane changes shows unnecessary lane
change;
- Abrupt steering trend from the steering abruptness beyond
the set value.
The system also shows each
driver's score on appropriate speed, headway distances and lane changes
according to the logged data above.
Ad hoc ranking can be also
provided. |
|
|
|


